If your 5th graders stare blankly when you mention line plots with fractional measurements, you’re not alone. Teaching students to create and interpret line plots using fractions like 1/2, 1/4, and 1/8 requires a careful blend of measurement understanding, fraction skills, and data analysis. The good news? With the right strategies, your students will confidently tackle this challenging standard.
Key Takeaway
Successful line plot instruction connects hands-on measurement experiences with visual data representation, building from concrete manipulatives to abstract problem-solving.
Why Line Plots with Fractions Matter in 5th Grade
Line plots with fractional measurements represent a critical intersection of three major mathematical domains: measurement, fractions, and data analysis. According to the National Council of Teachers of Mathematics, students who master data representation with fractions show 23% higher performance on standardized assessments compared to those who learn these skills in isolation.
This skill directly addresses CCSS.Math.Content.5.MD.B.2, which requires students to make line plots displaying measurement data in fractions of a unit and use fraction operations to solve problems involving the plotted information. The standard typically appears in the spring semester after students have developed fluency with fraction addition, subtraction, and comparison.
Research from the Common Core Mathematics Consortium shows that students who struggle with line plots often lack prerequisite skills in three areas: reading rulers to fractional units, understanding fractions as parts of a whole, and organizing data systematically. Addressing these foundational skills first dramatically improves success rates.
Looking for a ready-to-go resource? I put together a differentiated measurement & data pack that covers everything below — but first, the teaching strategies that make it work.
Common Line Plot Misconceptions in 5th Grade
Common Misconception: Students plot fractions as whole numbers (plotting 1/4 at position 1 instead of between 0 and 1).
Why it happens: They treat the numerator as the data point rather than understanding the fraction as a measurement.
Quick fix: Use number lines with clear fraction benchmarks before introducing line plots.
Common Misconception: Students stack X’s randomly above data points instead of creating organized columns.
Why it happens: They don’t understand that each X represents one data point and should align vertically.
Quick fix: Start with physical objects (cubes or counters) stacked above a floor number line.
Common Misconception: Students convert all fractions to decimals or mixed numbers before plotting.
Why it happens: They’re uncomfortable working directly with fractions in measurement contexts.
Quick fix: Emphasize that measurements like ‘3/4 inch’ are single units, not math problems to solve.
Common Misconception: Students can create line plots but can’t answer questions about the data.
Why it happens: They see plotting as separate from data analysis and fraction operations.
Quick fix: Always pair line plot creation with immediate questioning about patterns and calculations.
4 Research-Backed Strategies for Teaching Line Plots
Strategy 1: Concrete Measurement Before Abstract Plotting
Students need hands-on measurement experiences with fractional units before they can meaningfully represent that data. Start every line plot lesson with actual measuring using rulers marked in the target fractions.
What you need:
- Rulers marked in 1/8, 1/4, and 1/2 inches
- Small classroom objects (pencils, erasers, paper clips)
- Recording sheets with fraction number lines
- Sticky notes for data collection
Steps:
- Give each student 5-7 small objects and a ruler marked in eighths
- Have students measure each object to the nearest 1/8 inch, recording on sticky notes
- Create a class floor number line with tape, marked from 0 to 6 inches in eighth intervals
- Students place their sticky notes above the appropriate measurements
- Discuss patterns: ‘Which measurement appeared most often? How can we show this data on paper?’
- Transfer the floor data to paper line plots, emphasizing the connection
Strategy 2: The Build-Up Method for Data Organization
Rather than giving students completed data sets, have them build line plots incrementally. This approach helps students understand how each data point contributes to the overall distribution and prevents the overwhelming feeling of plotting many points at once.
What you need:
- Pre-drawn number lines with fraction intervals
- Data cards with individual measurements
- Different colored pencils or markers
- Timer for paced reveal
Steps:
- Provide a blank line plot with the scale already marked (0 to 5 inches in 1/4 intervals)
- Reveal one measurement at a time: ‘2 1/4 inches’
- Students locate and mark this point with an X
- Add the next measurement: ‘1 3/4 inches’ – students add another X
- Continue until 3-4 data points share the same value, creating the first ‘stack’
- Pause to discuss: ‘What do you notice about the X’s at 2 1/4?’
- Complete the data set and analyze patterns together
Strategy 3: Question Embedding for Deep Analysis
The CCSS.Math.Content.5.MD.B.2 standard requires students to solve problems using line plot data, not just create the plots. Embed questions throughout the plotting process to develop analytical thinking alongside data representation skills.
What you need:
- Completed line plots from previous activities
- Question stems posted visibly
- Partner discussion cards
- Calculators for fraction operations
Steps:
- After plotting 5-6 data points, pause for ‘Quick Analysis’: ‘Which measurement appears most often so far?’
- Midway through plotting: ‘What’s the difference between our highest and lowest measurements?’
- Upon completion: ‘How much longer is the longest object than the shortest?’
- Extension questions: ‘If we combined the three shortest objects, what would their total length be?’
- Partner share: Students explain their reasoning using the line plot as evidence
- Record strategies on anchor chart for future reference
Strategy 4: Real-World Connection Through Project-Based Measurement
Students understand line plots more deeply when the data comes from meaningful, student-generated investigations rather than abstract worksheets. Design measurement projects that naturally produce fractional data requiring line plot analysis.
What you need:
- Project choice boards (plant growth, paper airplane distances, pencil lengths)
- Data collection sheets spanning multiple days
- Rulers and measuring tapes marked in target fractions
- Digital cameras for documentation
Steps:
- Launch a week-long measurement investigation (e.g., ‘How much do our plants grow each day?’)
- Students collect daily measurements in fractional units (1/8 inch increments)
- After 5-7 days, compile class data for line plot creation
- Students create individual line plots, then compare with partners
- Culminate with presentations answering questions like ‘What was our average daily growth?’
- Connect to science or social studies standards when possible
How to Differentiate Line Plots for All Learners
For Students Who Need Extra Support
Begin with concrete manipulatives and simpler fractions. Use physical number lines on the floor where students can walk to different measurements. Provide pre-marked scales with only 1/2 and 1/4 intervals initially. Give fewer data points (5-8 instead of 15-20) and use measurements that cluster around common fractions. Offer sentence frames for analysis: ‘The most common measurement is ___’ and ‘The difference between the longest and shortest is ___.’
For On-Level Students
Work with the full range of fractions required by CCSS.Math.Content.5.MD.B.2: halves, fourths, and eighths. Use 12-15 data points per line plot and include questions requiring fraction addition and subtraction. Provide guided practice with both creating line plots and solving problems using the data. Encourage students to check their work by ensuring the number of X’s matches the number of data points collected.
For Students Ready for a Challenge
Extend to sixteenths or mixed measurement units (inches and centimeters). Have students create their own data collection questions and design investigations. Challenge them to find patterns across multiple line plots or to predict what additional data might look like. Introduce concepts like range, mode, and median using line plot data, connecting to 6th-grade statistics standards.
A Ready-to-Use Measurement & Data Resource for Your Classroom
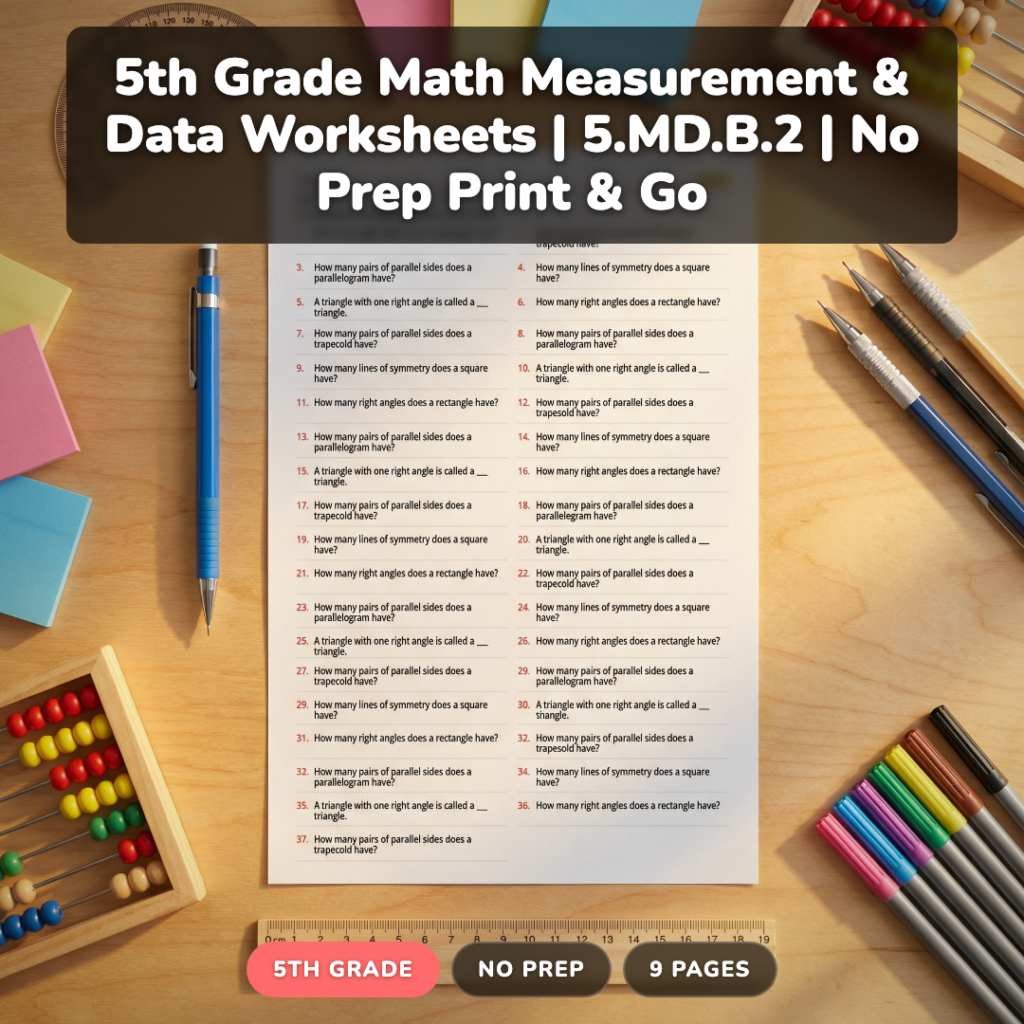
Teaching line plots with fractional measurements requires extensive practice across multiple difficulty levels. That’s why I created a comprehensive resource pack that takes the prep work out of differentiated instruction. This 9-page collection includes 132 problems spread across three distinct levels: Practice (37 problems), On-Level (50 problems), and Challenge (45 problems).
What makes this resource different is the careful progression within each level. The Practice section starts with simple 1/2 and 1/4 measurements, while the Challenge level incorporates complex fraction operations and multi-step problem solving. Each page includes answer keys and teaching notes, so you can focus on instruction rather than preparation.

The pack aligns perfectly with CCSS.Math.Content.5.MD.B.2 and provides immediate feedback opportunities through varied problem types. Whether you need quick warm-up problems, homework assignments, or assessment preparation, this resource adapts to your classroom needs.
Grab a Free Line Plot Sample to Try
Want to see how these strategies work in practice? I’ll send you a free sample page from the measurement pack, plus a bonus anchor chart for fraction measurement vocabulary. Perfect for trying out these techniques with your class before diving into the full resource.
Frequently Asked Questions About Teaching Line Plots
What prerequisite skills do students need before learning line plots with fractions?
Students should read rulers to 1/4 and 1/8 inch intervals, compare and order fractions with like denominators, and understand that fractions represent parts of whole units. They also need experience with basic data organization and simple addition/subtraction of fractions per CCSS.Math.Content.5.NF standards.
How do I help students who confuse line plots with bar graphs?
Emphasize that line plots show individual data points (each X represents one measurement) while bar graphs show categories or ranges. Use physical demonstrations with actual objects placed above number lines, then transition to X marks. Always start with the measurement activity before creating the visual representation.
What’s the best way to assess student understanding of line plots?
Provide a completed line plot and ask students to solve multi-step problems requiring fraction operations. Strong assessment questions include finding differences between data points, calculating totals, and identifying patterns. Students should also create line plots from given data sets to demonstrate complete understanding.
How often should I teach line plots throughout the year?
Introduce line plots after students master fraction addition and subtraction (typically January-February). Revisit monthly through measurement activities in science and math. The skill requires regular practice since students must coordinate multiple concepts: measurement, fractions, and data analysis simultaneously.
Can I connect line plots to other subjects besides math?
Absolutely! Science provides natural measurement opportunities: plant growth, weather data, or experiment results. Social studies can incorporate historical data or geographic measurements. Reading connects through data interpretation and vocabulary development. These cross-curricular connections help students see line plots as useful tools, not just math exercises.
Teaching line plots with fractional measurements challenges students to integrate multiple mathematical concepts, but with concrete experiences and systematic instruction, they’ll develop both computational skills and analytical thinking. Remember that the goal isn’t just creating accurate plots — it’s using those plots to solve meaningful problems and understand data patterns.
What measurement investigations have worked best in your classroom? Try the free sample above and see how your students respond to hands-on line plot instruction.