If your third graders stare blankly at scaled bar graphs or get confused when comparing data categories, you’re not alone. Teaching CCSS.Math.Content.3.MD.B.3 — scaled picture graphs and bar graphs — requires students to juggle multiple skills: understanding scale, interpreting data, and solving comparison problems. This post breaks down five research-backed strategies that make data analysis click for every learner in your classroom.
Key Takeaway
Students master scaled graphs when they build them step-by-step before interpreting them, starting with concrete objects and moving to abstract representations.
Why Data Graphs Matter in Third Grade
Third grade marks a critical shift in mathematical thinking. Students move from simple tally charts and pictographs (where one symbol equals one item) to scaled representations where symbols represent multiple units. This cognitive leap supports algebraic reasoning and proportional thinking that becomes essential in middle school mathematics.
Standard CCSS.Math.Content.3.MD.B.3 specifically requires students to draw scaled picture graphs and scaled bar graphs, then solve “how many more” and “how many less” problems using the data. Research from the National Council of Teachers of Mathematics shows that students who master data interpretation in elementary grades demonstrate stronger problem-solving skills in algebra and statistics later.
The timing matters too. This standard typically appears in the spring semester after students have solid addition and subtraction fact fluency and understand multiplication as repeated addition. Students need these foundational skills to work with scales effectively.
Looking for a ready-to-go resource? I put together a differentiated measurement & data pack that covers everything below — but first, the teaching strategies that make it work.
Common Data Graph Misconceptions in 3rd Grade
Common Misconception: Students count symbols instead of using the scale.
Why it happens: They’re used to one-to-one correspondence from earlier pictographs.
Quick fix: Always point to the key and say “each symbol represents [number]” before solving.
Common Misconception: Students think partial symbols can’t exist on scaled graphs.
Why it happens: They see symbols as whole objects that can’t be broken.
Quick fix: Use fraction language: “half a symbol represents half the scale value.”
Common Misconception: Students add all categories together for “how many more” problems.
Why it happens: They confuse comparison problems with total problems.
Quick fix: Circle the two categories being compared and cross out the rest.
Common Misconception: Students struggle with bar graph scales that don’t start at zero.
Why it happens: They assume the bottom of every bar represents zero.
Quick fix: Always read the y-axis labels together before interpreting data.
5 Research-Backed Strategies for Teaching Data Graphs
Strategy 1: Build Before You Read (Concrete to Abstract)
Students understand scaled graphs better when they create them with physical objects first. This concrete-representational-abstract (CRA) approach helps students see why scales exist and how they work.
What you need:
- Connecting cubes or counting bears (10 per student)
- Chart paper
- Sticky notes
- Real data (favorite pizza toppings, pets, etc.)
Steps:
- Survey the class on a topic and record responses
- Have students build towers with cubes representing each category
- Discuss: “What if we had 100 students? Our towers would be too tall!”
- Introduce scale: “Let’s say each cube represents 2 students”
- Rebuild towers using the scale
- Transfer to paper as a bar graph
Strategy 2: Key Detective (Scale Awareness)
Students often ignore the key or legend when interpreting scaled graphs. This strategy makes the key the star of every graph analysis session.
What you need:
- Sample scaled graphs
- Magnifying glasses (real or toy)
- Yellow highlighters
- “Key Detective” badges
Steps:
- Give each student a “Key Detective” badge
- Present a scaled graph with the key covered
- Ask: “Can you solve this graph problem?” (They can’t without the key)
- Reveal the key with fanfare
- Have students highlight the key in yellow on every graph
- Establish the rule: “Key first, then solve”
Strategy 3: The Comparison Circle Method
“How many more” and “how many less” problems confuse students because they involve multiple steps. This visual strategy breaks down comparison problems into manageable parts.
What you need:
- Colored pencils or markers
- Pre-drawn circles or templates
- Laminated graphs for practice
- Dry erase markers
Steps:
- Read the problem and identify the two categories being compared
- Circle those categories in different colors
- Find the value for each circled category using the scale
- Write the values next to each circle
- Subtract to find the difference
- Write the answer with units
Strategy 4: Picture Graph Theater
Students act out picture graph scenarios to understand how symbols represent groups of objects. This kinesthetic approach helps visual and tactile learners grasp scaling concepts.
What you need:
- Student volunteers (groups of 2, 4, 5, or 10)
- Picture graph templates
- Symbol cutouts
- Tape or magnets
Steps:
- Choose a scale (each symbol = 2 students)
- Have students form groups matching the scale
- Each group becomes “one symbol” on the graph
- Groups take turns standing in front of the graph
- Place one symbol for each group
- Solve problems using the human graph, then the paper version
Strategy 5: Error Analysis Gallery Walk
Students learn from common mistakes by analyzing incorrect graph interpretations. This metacognitive approach strengthens their reasoning skills and error-detection abilities.
What you need:
- Sample student work with intentional errors
- Sticky notes
- Red and green markers
- Gallery walk protocol sheet
Steps:
- Post graphs with both correct and incorrect solutions around the room
- Students walk in pairs, examining each solution
- They place green sticky notes on correct work, red on errors
- For errors, they write what went wrong and the correct answer
- Debrief common mistakes as a class
- Create a “Graph Mistakes to Avoid” anchor chart
How to Differentiate Data Graphs for All Learners
For Students Who Need Extra Support
Start with scales of 1 before moving to 2. Provide graphs with clear, bold keys and consistent symbol placement. Use concrete manipulatives longer, allowing students to build every graph physically before drawing. Focus on one-step “how many more” problems before introducing two-step scenarios. Highlight key words in problems (“more than,” “less than,” “difference”) and provide sentence frames for answers.
For On-Level Students
Work with scales of 2, 5, and 10 throughout the unit. Practice both picture graphs and bar graphs equally. Include a mix of one-step and two-step comparison problems. Encourage students to explain their reasoning and check their work by re-reading the scale. Use real-world data that connects to student interests and classroom activities.
For Students Ready for a Challenge
Introduce scales with larger numbers (25, 50, 100) and fractional symbols (half symbols representing half the scale value). Present graphs with missing information that students must calculate. Include multi-step problems requiring addition and subtraction: “How many more cats and dogs are there than birds and fish combined?” Connect to fourth-grade concepts by introducing line plots with fractional data.
A Ready-to-Use Measurement & Data Resource for Your Classroom
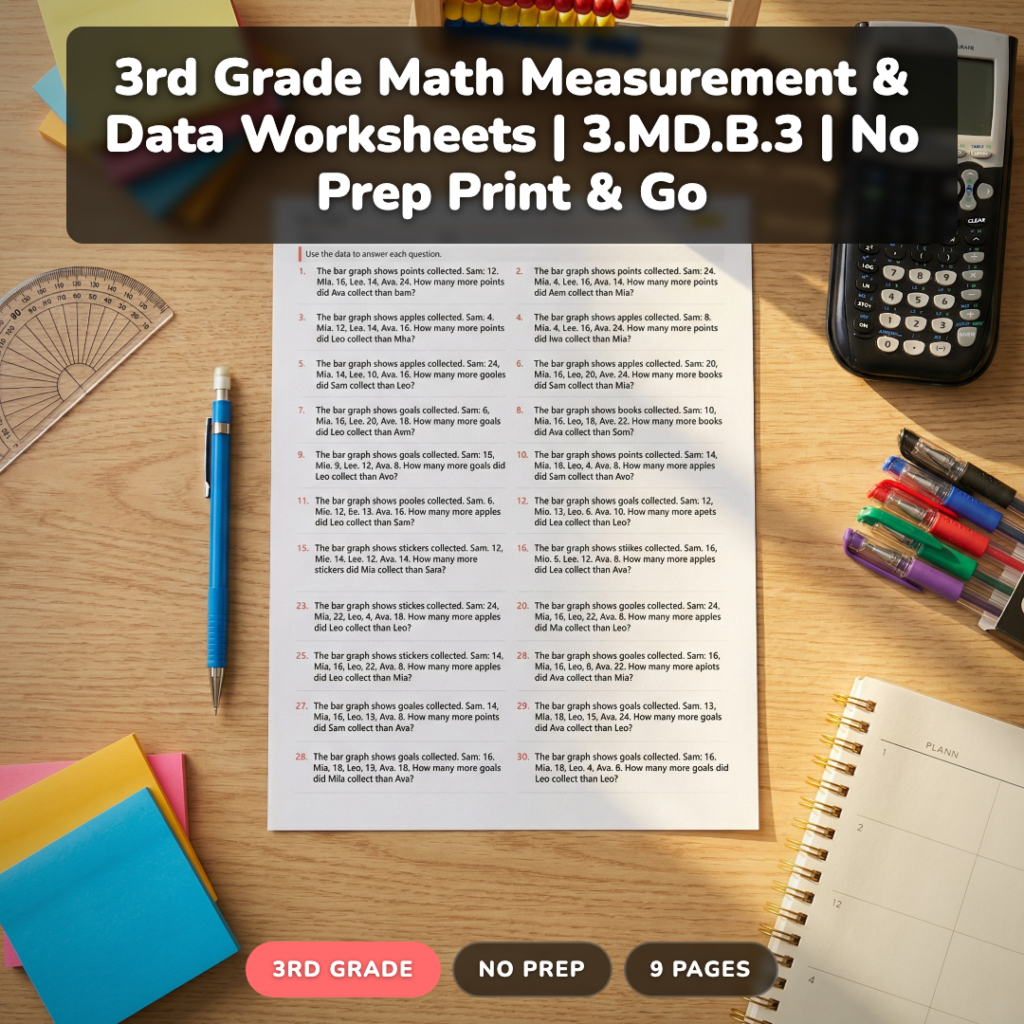
If you’re looking for differentiated practice that covers all aspects of CCSS.Math.Content.3.MD.B.3, this measurement and data worksheet pack saves hours of prep time. It includes 132 problems across three difficulty levels: 37 practice problems for building foundational skills, 50 on-level problems for grade-appropriate practice, and 45 challenge problems for extending learning.
What makes this resource different is the systematic progression. Practice level focuses on scales of 1 and 2 with clear visual supports. On-level includes scales up to 10 with mixed problem types. Challenge level incorporates fractional symbols and multi-step reasoning problems. Each level includes both picture graphs and bar graphs, so students get comprehensive practice with both representations.
The answer keys show step-by-step solutions, making it easy to identify exactly where students need additional support.
All 9 pages are print-and-go ready — no prep required. Just choose the level that matches each student’s needs and you’re set for weeks of meaningful practice.

Grab a Free Sample Graph to Try
Want to see how these strategies work in practice? I’ll send you a free sample scaled bar graph with a step-by-step solution guide that shows exactly how to teach the comparison method. Perfect for trying out these techniques with your class.
Frequently Asked Questions About Teaching Data Graphs
What’s the difference between a pictograph and a scaled picture graph?
A pictograph uses one symbol to represent one item (one apple = one student’s vote). A scaled picture graph uses one symbol to represent multiple items (one apple = 5 students’ votes). Third graders work with scaled versions per CCSS.Math.Content.3.MD.B.3.
How do I help students who struggle with scales greater than 2?
Start with skip counting practice for that number. If using a scale of 5, practice counting by 5s daily. Use number lines and hundreds charts to reinforce the pattern. Always have students point to each symbol while skip counting the total.
Should third graders work with fractional symbols on graphs?
Yes, but introduce carefully. Start with half symbols only (not quarters or other fractions). Use concrete examples: “If each symbol represents 4 students, half a symbol represents 2 students.” This prepares them for fourth-grade fraction work.
When should I introduce bar graphs versus picture graphs?
Introduce picture graphs first because the symbols provide visual support. Once students understand scaling with pictures, transition to bar graphs. Many teachers do picture graphs in fall/winter and add bar graphs in spring for CCSS.Math.Content.3.MD.B.3 mastery.
How do I assess student understanding of scaled graphs?
Use three-part assessments: graph creation (can they make a scaled graph from data?), interpretation (can they read values correctly?), and problem solving (can they answer comparison questions?). Each part reveals different aspects of understanding.
Making Data Analysis Stick
Teaching scaled graphs successfully comes down to building understanding step-by-step and giving students plenty of practice with the key concepts. When students can create graphs, read scales accurately, and solve comparison problems confidently, they’re ready for the more complex data analysis they’ll encounter in fourth grade and beyond.
What’s your biggest challenge when teaching data graphs? Try one of these strategies this week and grab the free sample graph to see how the comparison circle method works in action.