If your second graders look confused when you mention “line plots,” you’re not alone. Many students struggle to connect measuring objects with organizing that data visually. The good news? With the right teaching strategies, your students can master CCSS.Math.Content.2.MD.D.9 and feel confident creating their own line plots from measurement data.
Key Takeaway
Second graders learn line plots best when they physically measure real objects first, then gradually move to representing that data on paper.
Why Line Plots Matter in Second Grade
Line plots bridge the gap between hands-on measurement and data analysis — two critical math skills your students will use throughout elementary school. According to the Common Core standard CCSS.Math.Content.2.MD.D.9, students should generate measurement data by measuring objects to the nearest whole unit and display this information on line plots with whole-number scales.
This standard typically appears in the spring semester, after students have mastered measuring with standard units like inches and centimeters. Research from the National Council of Teachers of Mathematics shows that students who understand data representation in second grade perform 23% better on standardized math assessments in later grades.
Line plots help students see patterns in data, compare measurements, and ask mathematical questions like “Which length appears most often?” or “How many objects measured exactly 4 inches?” These skills directly connect to third-grade fraction work and statistical reasoning.
Looking for a ready-to-go resource? I put together a differentiated measurement & data pack that covers everything below — but first, the teaching strategies that make it work.
Common Line Plot Misconceptions in 2nd Grade
Common Misconception: Students think each X represents a different object rather than one measurement.
Why it happens: They confuse the X symbols with actual pictures of the measured items.
Quick fix: Use real objects and physically place them above the number line before drawing Xs.
Common Misconception: Students stack Xs randomly instead of in neat columns above each number.
Why it happens: They don’t understand that organization makes data easier to read and compare.
Quick fix: Model building “towers” of Xs, emphasizing how neat columns help us count quickly.
Common Misconception: Students create number lines that skip numbers or don’t match their data range.
Why it happens: They rush to start plotting without analyzing their measurement results first.
Quick fix: Always have students identify their smallest and largest measurements before creating the number line.
Common Misconception: Students think line plots and bar graphs are the same thing.
Why it happens: Both show data vertically, but students miss the key difference in how data points are represented.
Quick fix: Explicitly compare the two formats side-by-side, highlighting that line plots use Xs while bar graphs use solid bars.
5 Research-Backed Strategies for Teaching Line Plots
Strategy 1: Concrete Object Measurement Gallery Walk
Start with real objects that students can physically handle and measure. This concrete experience builds the foundation for abstract line plot creation.
What you need:
- 10-15 classroom objects (pencils, crayons, paper clips, books)
- Rulers or measuring tapes
- Recording sheets
- Chart paper for class line plot
Steps:
- Set up measurement stations around the room with different objects
- Students rotate in pairs, measuring each object to the nearest inch
- Record measurements on individual data sheets
- Gather as a class and compile all measurements on chart paper
- Create a large floor line plot using actual objects placed above number cards
- Transfer the physical arrangement to a paper line plot using Xs
Strategy 2: Human Line Plot with Student Heights
Transform your students into living data points by measuring their heights and creating a human line plot in your classroom.
What you need:
- Measuring tape or yard stick
- Masking tape for floor number line
- Index cards with numbers
- Chart paper for recording
Steps:
- Measure each student’s height to the nearest inch (or foot for larger ranges)
- Create a number line on the floor using masking tape
- Place number cards at appropriate intervals
- Have students stand above their height measurement on the floor line
- Count students at each height and discuss what you notice
- Draw the corresponding line plot on chart paper with student input
Strategy 3: Digital Line Plot Building with Interactive Tools
Use technology to help students visualize how data transforms into line plots through interactive manipulation.
What you need:
- Tablets or computers
- Digital graphing tools (Google Sheets, online line plot makers)
- Pre-measured data sets
- Projection screen for modeling
Steps:
- Provide students with a data set of measurements (pet lengths, book widths, etc.)
- Demonstrate how to input data into the digital tool
- Show how the tool automatically creates the line plot
- Have students manipulate the data to see how the plot changes
- Compare digital plots to hand-drawn versions
- Discuss advantages of each method
Strategy 4: Story Problem Line Plot Creation
Connect line plots to real-world scenarios through engaging story problems that require students to organize and display measurement data.
What you need:
- Story problem scenarios
- Measurement data embedded in stories
- Graph paper or line plot templates
- Colored pencils for different data sets
Steps:
- Present a story scenario (“Ms. Garcia’s class measured their pet fish”)
- Provide the measurement data within the story context
- Guide students through identifying the range of measurements
- Have students create appropriate number lines
- Plot data points as Xs above corresponding numbers
- Answer questions about the data using the completed line plot
Strategy 5: Comparative Line Plot Analysis
Deepen understanding by having students create and compare multiple line plots from different measurement scenarios.
What you need:
- Two related data sets (morning vs. afternoon temperatures, different classroom objects)
- Side-by-side graph paper
- Comparison question prompts
- Discussion sentence frames
Steps:
- Provide two related but different measurement data sets
- Students create line plots for each data set side-by-side
- Use the same scale for both plots to enable comparison
- Ask guided questions: “Which data set has more variety?” “Where do you see similarities?”
- Students write observations comparing the two line plots
- Share findings with the class through structured discussions
How to Differentiate Line Plots for All Learners
For Students Who Need Extra Support
Start with smaller data sets (5-8 measurements) and use concrete manipulatives longer. Provide pre-drawn number lines with clear spacing and use larger graph paper. Focus on one-step questions like “How many objects measured 3 inches?” before moving to comparisons. Consider using pictures instead of Xs initially, then transition to the standard format.
For On-Level Students
Use standard data sets of 10-15 measurements that align with CCSS.Math.Content.2.MD.D.9 expectations. Students should create their own number lines and answer both literal and interpretive questions about their line plots. Include practice with different measurement units (inches, centimeters, feet) throughout the year.
For Students Ready for a Challenge
Introduce larger data sets (15-20 measurements) and have students collect their own measurement data through classroom investigations. Challenge them to create line plots with different scales or compare multiple data sets. Connect to early fraction concepts by discussing “most common” and “least common” measurements as fractions of the whole group.
A Ready-to-Use Measurement & Data Resource for Your Classroom
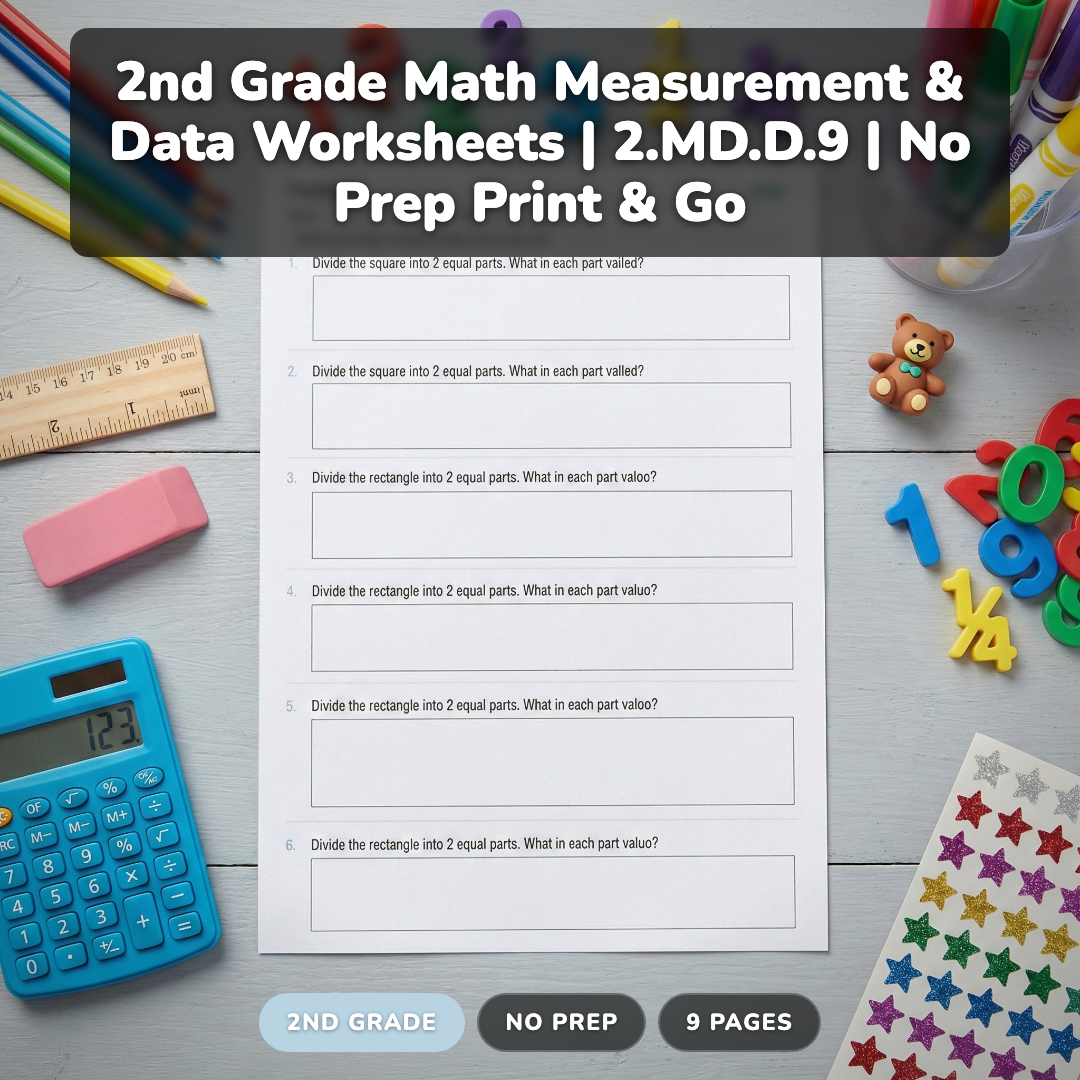
Teaching line plots effectively requires plenty of practice problems at different difficulty levels. This differentiated measurement and data worksheet pack includes 106 carefully crafted problems across three levels: 30 practice problems for building foundational skills, 40 on-level problems that align perfectly with second-grade expectations, and 36 challenge problems for students ready to extend their thinking.
Each level includes varied problem types: creating line plots from given data, interpreting existing line plots, and answering questions that require data analysis. The pack covers different measurement contexts — from measuring classroom objects to analyzing growth data — giving students multiple opportunities to apply their skills. Answer keys are included for quick assessment and feedback.
What makes this resource special is its true differentiation. Rather than just changing numbers, each level scaffolds the complexity of thinking required. Practice problems focus on basic line plot creation, on-level problems add interpretation questions, and challenge problems require students to make connections between multiple representations.
Grab a Free Line Plot Practice Sheet to Try
Want to test these strategies with your students? I’ve created a free sample worksheet that includes measurement data and guided line plot creation. It’s perfect for introducing the concept or reviewing before assessments.
Frequently Asked Questions About Teaching Line Plots
When should I introduce line plots in second grade?
Introduce line plots after students master measuring with standard units, typically in late winter or early spring. Students need solid measurement skills before they can organize measurement data effectively on line plots.
How do line plots connect to other second grade math standards?
Line plots connect directly to measurement standards (CCSS.Math.Content.2.MD.A.1-4) and support number line understanding. They also build foundation skills for third-grade data analysis and early fraction concepts through data interpretation.
What’s the difference between line plots and bar graphs for second graders?
Line plots use X marks above a number line to show individual data points, while bar graphs use solid bars to show quantities. Line plots work better for measurement data because they preserve individual measurements rather than just showing totals.
How can I help students who struggle with creating accurate number lines?
Start with pre-drawn number lines and focus on plotting data first. Gradually introduce number line creation by having students identify the range of their data before drawing. Use graph paper to help with consistent spacing.
Should second graders use technology tools for creating line plots?
Technology can enhance understanding when used after students grasp the concept with paper and pencil. Digital tools help students see how changing data affects the plot, but hand-drawing develops deeper conceptual understanding initially.
Building Data Literacy One Line Plot at a Time
Teaching line plots in second grade sets the foundation for years of data analysis skills. When students can confidently measure objects, organize that data, and represent it visually, they’re developing mathematical reasoning that extends far beyond this single standard.
Start with concrete experiences, use real classroom data whenever possible, and remember that students need multiple opportunities to practice before mastering this skill. What measurement data will your students explore first?
Don’t forget to grab your free line plot practice sheet above — it’s a great way to see these strategies in action with your students.