If your second graders look confused when you mention bar graphs or picture graphs, you’re not alone. Many teachers find that students struggle to connect data collection with visual representation — but with the right approach, your students can master CCSS.Math.Content.2.MD.D.10 and actually enjoy working with data.
Here’s exactly how to teach data and graphs in second grade using research-backed strategies that make abstract concepts concrete and engaging for young learners.
Key Takeaway
Second graders learn data skills best through hands-on collection activities followed by step-by-step graph construction using familiar, concrete topics.
Why Data Skills Matter in Second Grade
Data and graphing skills form the foundation for statistical reasoning that students will use throughout their academic careers. At the second-grade level, CCSS.Math.Content.2.MD.D.10 requires students to draw picture graphs and bar graphs with single-unit scales to represent data sets with up to four categories, then solve simple problems using the information.
Research from the National Council of Teachers of Mathematics shows that students who master basic data representation in elementary grades perform 23% better on middle school statistics assessments. The key is connecting data to students’ real experiences — their favorite colors, pets, or snacks — before moving to abstract datasets.
This standard typically appears in the spring semester, after students have solid addition and subtraction skills within 100. Students need to understand one-to-one correspondence and counting by ones before tackling graph interpretation.
Looking for a ready-to-go resource? I put together a differentiated measurement and data pack that covers everything below — but first, the teaching strategies that make it work.
Common Data & Graphing Misconceptions in 2nd Grade
Common Misconception: Students think taller bars always mean “better” or “more important.”
Why it happens: They associate height with value from everyday experiences.
Quick fix: Explicitly teach that bar height shows quantity, not importance.
Common Misconception: Students count spaces between symbols instead of the symbols themselves in picture graphs.
Why it happens: They focus on visual gaps rather than discrete objects.
Quick fix: Use physical manipulatives first, then transition to drawn symbols.
Common Misconception: Students think each symbol in a picture graph represents a different amount.
Why it happens: They don’t understand the one-to-one correspondence concept.
Quick fix: Start with concrete objects before moving to symbolic representation.
Common Misconception: Students read bar graphs from right to left instead of bottom to top.
Why it happens: They apply reading patterns to mathematical representations.
Quick fix: Use finger tracing from the category label up to the bar top.
5 Research-Backed Strategies for Teaching Data & Graphs
Strategy 1: Real Data Collection with Physical Sorting
Start with concrete data collection using topics students care about. This builds the conceptual foundation before introducing formal graphing.
What you need:
- Chart paper or large whiteboard
- Sticky notes or index cards
- Markers or crayons
- Collection containers or sorting mats
Steps:
- Choose a relevant question (“What’s your favorite season?” or “How do you get to school?”)
- Have students write their name on a sticky note
- Create physical categories on the floor using tape or mats
- Students place their sticky note in the correct category
- Count together and discuss which category has the most/least
- Ask comparison questions: “How many more students like summer than winter?”
Strategy 2: Picture Graph Construction with One-to-One Correspondence
Transform the physical data into picture graphs using systematic, step-by-step construction that emphasizes the connection between real objects and symbols.
What you need:
- Grid paper or pre-made graph templates
- Small manipulatives (cubes, counters)
- Crayons or stickers
- Data from previous collection activity
Steps:
- Review the data collected in the physical sorting activity
- Place one manipulative for each data point in the correct column
- Replace each manipulative with a drawn symbol or sticker
- Add a title that matches the original question
- Label each category clearly
- Practice reading the graph: “The graph shows that ___ students chose ___”
Strategy 3: Bar Graph Building with Structured Steps
Introduce bar graphs as another way to show the same data, emphasizing the connection between picture graphs and bar representations.
What you need:
- Grid paper with large squares
- Colored pencils or crayons
- Rulers
- Previously created picture graph
Steps:
- Start with the same data from the picture graph
- Draw category labels along the bottom axis
- Count the symbols in each picture graph column
- Color one square for each piece of data, building upward
- Add numbers along the side axis (0, 1, 2, 3, etc.)
- Compare the bar graph to the picture graph: “Both show the same information”
Strategy 4: Graph Interpretation Through Structured Questioning
Develop students’ ability to extract information from graphs using a progression of question types that build analytical thinking skills.
What you need:
- Completed picture and bar graphs
- Question stems chart
- Individual whiteboards
- Dry erase markers
Steps:
- Start with direct reading questions: “How many students chose pizza?”
- Move to comparison questions: “Which food was chosen by the most students?”
- Practice difference questions: “How many more students chose pizza than salad?”
- Ask total questions: “How many students answered the survey?”
- Students write answers on whiteboards and show simultaneously
- Discuss strategies for finding answers
Strategy 5: Interactive Graph Games for Fluency Building
Use engaging activities that reinforce graph reading skills while maintaining student interest and motivation.
What you need:
- Pre-made graph cards
- Question cards
- Timer
- Small prizes or stickers
Steps:
- Create pairs and give each pair a graph card
- Partners take turns drawing question cards
- One student asks the question, the other finds the answer on the graph
- Switch roles after each question
- Use a timer to add excitement (30 seconds per question)
- Rotate graph cards every 5 minutes
How to Differentiate Data & Graphs for All Learners
For Students Who Need Extra Support
Begin with concrete manipulatives and real objects before moving to any symbolic representation. Use only two categories initially and provide pre-drawn graph templates with clear gridlines. Offer sentence frames for graph interpretation (“I see ___ students chose ___”). Focus on direct reading questions before attempting comparison problems. Provide one-on-one support during the transition from physical sorting to picture graphs.
For On-Level Students
Students work with 3-4 categories as specified in CCSS.Math.Content.2.MD.D.10 and create both picture and bar graphs independently. They should solve simple put-together, take-apart, and compare problems using graph information. Encourage students to explain their thinking when interpreting graphs and check their work by counting twice.
For Students Ready for a Challenge
Extend learning by having students collect their own data through surveys, create graphs with more complex categories, or work with larger data sets. Challenge them to write their own questions about graphs and solve multi-step problems. Introduce simple concepts about which graph type works better for different data types.
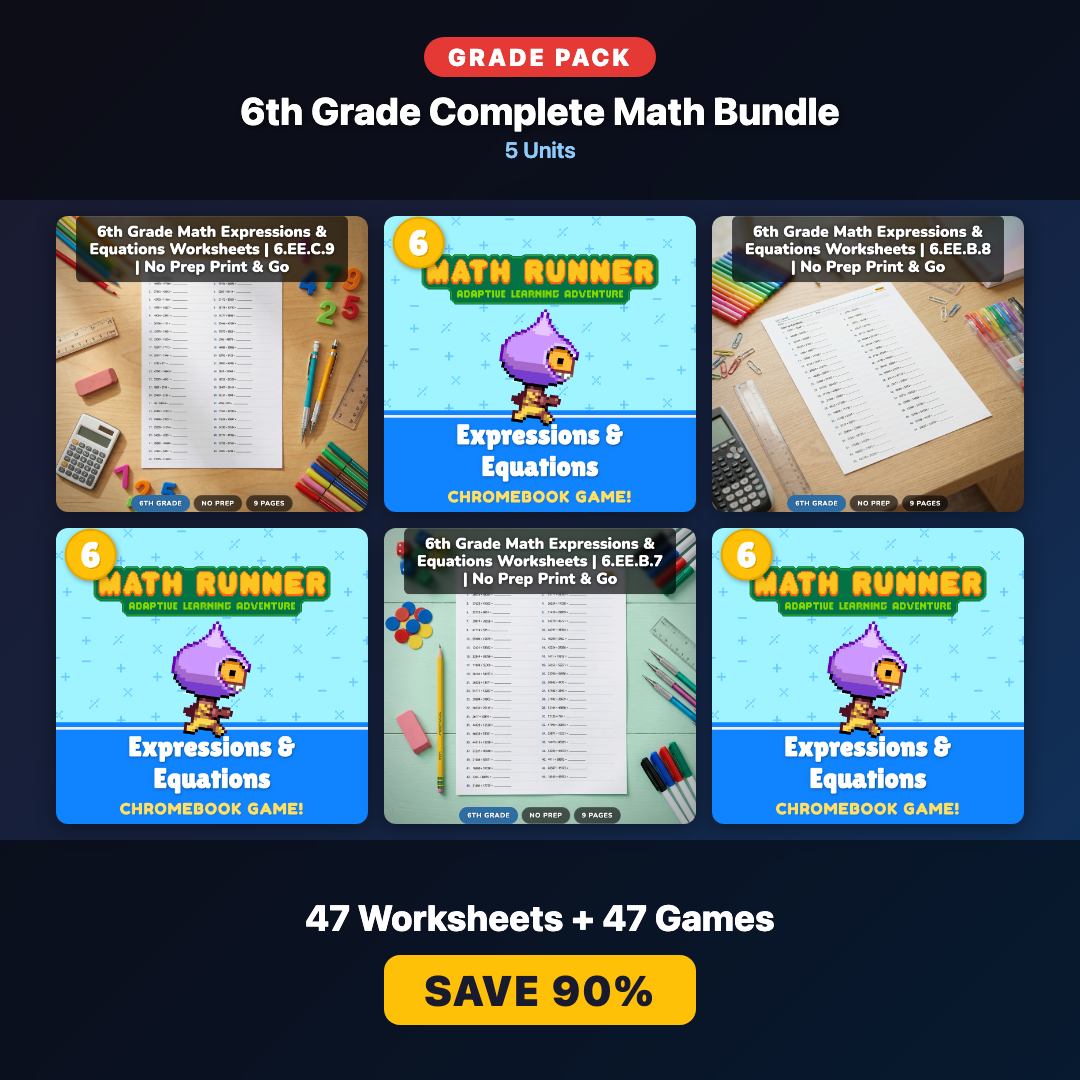
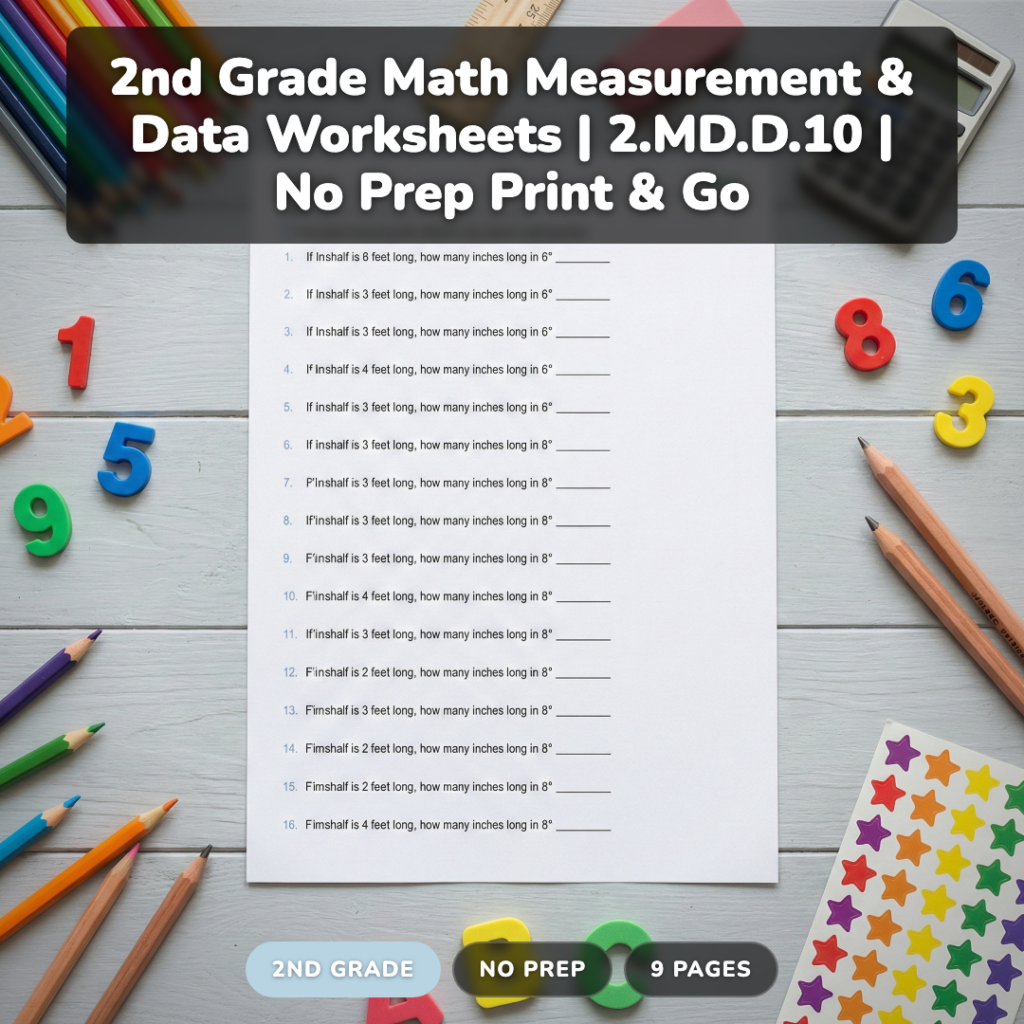
A Ready-to-Use Data & Graphs Resource for Your Classroom
Teaching data and graphing skills requires lots of practice problems at just the right level for each student. After years of creating my own materials, I developed a comprehensive resource that takes the guesswork out of differentiation.
This measurement and data pack includes 106 problems across three difficulty levels: 30 practice problems for students who need extra support, 40 on-level problems that align perfectly with grade-level expectations, and 36 challenge problems for students ready to extend their learning. Each level focuses on picture graphs and bar graphs with single-unit scales, exactly what CCSS.Math.Content.2.MD.D.10 requires.
What makes this resource different is the careful scaffolding within each level. Students start with direct reading questions, progress to comparison problems, and finish with put-together and take-apart scenarios. The answer keys include step-by-step solutions, so you can easily support students who get stuck.
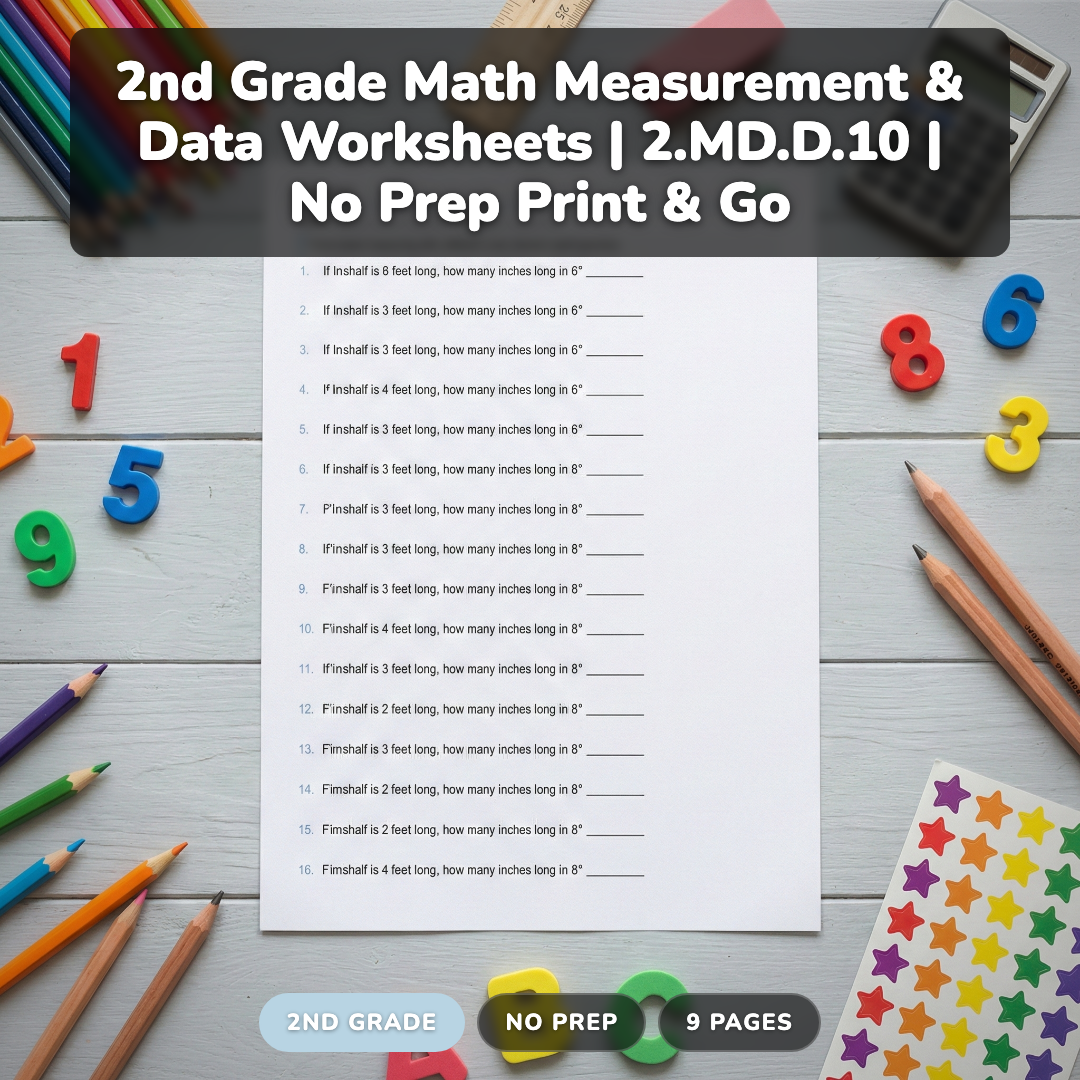
All 9 pages are ready to print and use immediately — no prep time required. Perfect for math centers, homework, or assessment preparation.
Grab a Free Data Collection Activity to Try
Want to see how engaging data collection can be? I’ll send you a complete “Favorite Pet” survey activity with recording sheets and graphing templates. Perfect for trying out these strategies with your class.
Frequently Asked Questions About Teaching Data & Graphs
What’s the difference between picture graphs and bar graphs for second graders?
Picture graphs use symbols or drawings to represent data (like smiley faces for favorite activities), while bar graphs use colored rectangles or bars. Both show the same information, but picture graphs feel more concrete to young learners while bar graphs introduce mathematical conventions they’ll use in higher grades.
How many categories should second-grade graphs include?
According to CCSS.Math.Content.2.MD.D.10, second graders should work with up to four categories. Start with two categories for struggling students, use three for most lessons, and challenge advanced students with four categories. More than four becomes overwhelming at this grade level.
Should second graders create their own graphs or just interpret pre-made ones?
Students need both experiences. Start with interpreting teacher-made graphs to build reading skills, then progress to creating graphs from provided data sets. Finally, have students collect their own data and create complete graphs independently. This progression builds both analytical and construction skills.
What types of data work best for second-grade graph activities?
Use data that connects to students’ lives: favorite foods, pets, seasons, ways to get to school, or classroom supplies. Avoid abstract topics or unfamiliar categories. The more personally relevant the data, the more engaged students will be in the graphing process.
How do I help students who confuse picture graphs with bar graphs?
Create the same data set as both graph types side by side. Have students count the symbols in the picture graph, then count the squares in the corresponding bar graph. Emphasize that both graphs show identical information using different visual methods. Practice converting between the two formats regularly.
Teaching data and graphing skills in second grade builds critical mathematical thinking that students will use for years to come. Start with concrete experiences, provide plenty of practice, and celebrate when students make connections between data and visual representations.
What’s your favorite way to collect data with second graders? The more relevant the topic, the more engaged your students will be in creating and interpreting their graphs.