If your first graders look confused when you mention “data” or freeze up at the sight of a simple bar graph, you’re not alone. Teaching measurement and data concepts to 6-year-olds requires breaking down abstract thinking into concrete, hands-on experiences they can understand and enjoy.
Key Takeaway
First graders learn data concepts best through real objects they can sort, count, and compare before moving to abstract graphs and charts.
Why Data Skills Matter in First Grade
Data collection and interpretation form the foundation for mathematical reasoning that students will use throughout their academic careers. In first grade, CCSS.Math.Content.1.MD.C.4 requires students to organize, represent, and interpret data with up to three categories while asking and answering questions about totals, individual categories, and comparisons between groups.
Research from the National Council of Teachers of Mathematics shows that students who master basic data concepts in early elementary grades demonstrate stronger problem-solving skills and mathematical reasoning in later years. The key is making data collection feel natural and purposeful rather than abstract and intimidating.
This standard typically appears in the spring semester, after students have developed solid counting skills and basic addition/subtraction fluency. Students need to confidently count to 20 and understand comparison language (more, less, same) before tackling data interpretation successfully.
Looking for a ready-to-go resource? I put together a differentiated measurement & data pack with 106 problems across three levels — but first, the teaching strategies that make it work.
Common Data & Measurement Misconceptions in 1st Grade
Common Misconception: Students think taller bars on a graph always mean “better” or “winning.”
Why it happens: They associate height with positive value from real-world experiences.
Quick fix: Use neutral categories like “favorite colors” rather than competitive scenarios when introducing graphs.
Common Misconception: Students count spaces between objects rather than the objects themselves when reading pictographs.
Why it happens: Visual processing focuses on gaps rather than symbols.
Quick fix: Have students point to and count each symbol individually while saying the number aloud.
Common Misconception: Students think data must be collected about people, not objects or preferences.
Why it happens: Early examples often focus on student surveys about favorites.
Quick fix: Include data collection about classroom objects, weather patterns, or story characters to broaden understanding.
Common Misconception: Students believe you need the same number in each category for data to be “correct.”
Why it happens: They confuse equal sharing concepts with data collection.
Quick fix: Emphasize that real data often shows different amounts in each group, and that’s perfectly normal.
5 Research-Backed Strategies for Teaching Data Skills
Strategy 1: Real Object Sorting Before Abstract Graphs
Start with physical objects students can manipulate before introducing any paper-based graphs. This concrete-representational-abstract progression helps students understand that graphs represent real things.
What you need:
- Collection of similar objects with 2-3 obvious categories (crayons by color, blocks by shape, snacks by type)
- Large floor space or table
- Label cards for categories
Steps:
- Give each student 3-4 objects from your collection
- Create labeled areas on the floor (“Red Crayons,” “Blue Crayons,” “Green Crayons”)
- Have students place their objects in the correct category
- Count each group together, emphasizing the total
- Ask comparison questions: “Which color has the most? How many more red than blue?”
- Record results on chart paper before moving to worksheet practice
Strategy 2: Human Bar Graphs for Kinesthetic Learning
Transform your students into living data points to make abstract graphing concepts concrete and memorable. This strategy works especially well for surveying student preferences.
What you need:
- Masking tape to create floor lines
- Category labels on large cards
- Survey question (favorite season, pet preference, etc.)
Steps:
- Create 2-3 parallel lines on the floor using masking tape
- Place category labels at the base of each line
- Ask your survey question and have students stand behind their choice
- Students line up single-file behind their category label
- Count each “human bar” together
- Take a photo to reference later when creating paper graphs
- Ask questions: “Which line is longest? How many students chose dogs?”
Strategy 3: Daily Data Collection Routines
Integrate data collection into your daily schedule so students practice the skill regularly with real, meaningful information they care about.
What you need:
- Weather chart or daily question poster
- Sticky notes or counting cubes
- Data recording sheet
Steps:
- Choose a daily data point (weather, lunch choice, how students got to school)
- Create a simple graph template on chart paper
- Each student adds their data point (sticky note, cube, or tally mark)
- Count and record totals during morning meeting
- Ask one comparison question daily
- Review weekly patterns on Fridays
Strategy 4: Story-Based Data Problems
Connect data concepts to familiar story contexts, making abstract numbers feel relevant and engaging for young learners.
What you need:
- Simple story scenarios (written or oral)
- Counting manipulatives
- Pre-drawn graph templates
Steps:
- Tell a story: “The three little pigs built houses. 2 used straw, 4 used sticks, 3 used bricks.”
- Students use manipulatives to represent each house type
- Transfer the physical count to a pictograph
- Ask story-connected questions: “How many more stick houses than straw houses?”
- Let students create their own story data problems
Strategy 5: Interactive Questioning Techniques
Develop students’ ability to ask and answer data questions through structured practice with question stems and thinking prompts.
What you need:
- Question stem cards (“How many…?” “Which has more…?” “How many fewer…?”)
- Completed graphs or data displays
- Think-pair-share structure
Steps:
- Display a simple graph with clear data
- Model asking questions using sentence stems
- Students practice with a partner using question cards
- Share questions with the whole class
- Answer questions together, showing where to find information on the graph
- Students create their own questions for homework or centers
How to Differentiate Data Skills for All Learners
For Students Who Need Extra Support
Focus on concrete counting and one-to-one correspondence before introducing graphs. Use real objects exclusively for the first few weeks, ensuring students can accurately count groups of 1-5 objects. Provide number lines and counting charts as visual supports. Limit data categories to 2 choices initially, and use familiar, concrete categories like “boys and girls” or “apples and oranges.” Practice comparison language (more, less, same) with physical objects daily before applying to data contexts.
For On-Level Students
Students working at grade level should comfortably handle CCSS.Math.Content.1.MD.C.4 expectations with 3 categories and numbers up to 10 in each group. They can transition from concrete objects to pictographs within 2-3 weeks of instruction. Focus on asking and answering all three question types: totals (“How many students chose pizza?”), category comparisons (“How many more chose pizza than tacos?”), and overall analysis (“Which food was most popular?”). Provide regular practice with both teacher-created and student-generated data sets.
For Students Ready for a Challenge
Advanced students can work with 4 categories, larger numbers (up to 20), and more complex comparison questions. Introduce simple bar graphs alongside pictographs, and encourage students to collect their own data from family members or other classes. Challenge them to identify patterns (“Pizza is always most popular on Fridays”) and make predictions about future data collection. These students can also create word problems for classmates to solve using data displays.
A Ready-to-Use Data & Measurement Resource for Your Classroom
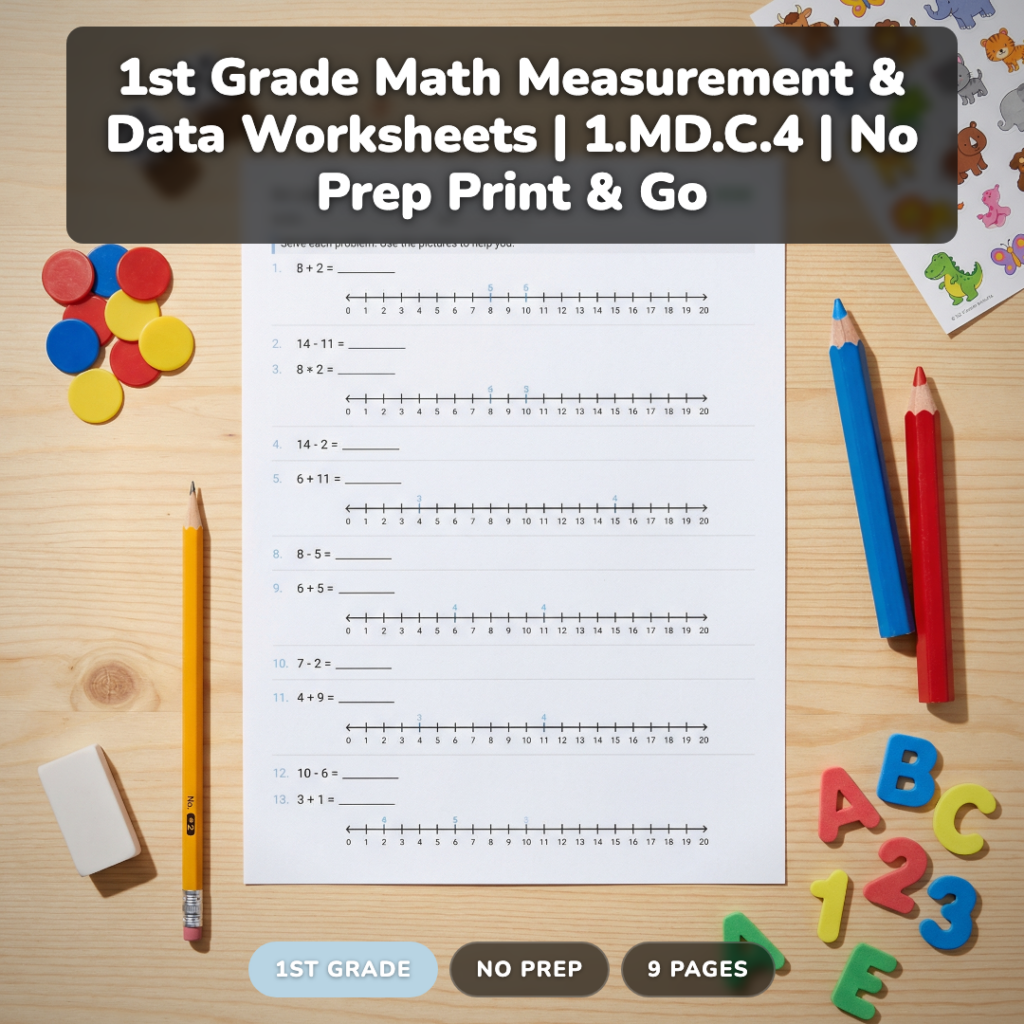
After years of creating data activities from scratch, I developed a comprehensive measurement and data worksheet pack that covers all the strategies above while saving you hours of prep time. This resource includes 106 differentiated problems across 9 pages, perfectly aligned with CCSS.Math.Content.1.MD.C.4.
The pack includes three distinct levels: Practice (30 problems for students needing extra support), On-Level (40 problems for grade-level expectations), and Challenge (36 problems for advanced learners). Each level uses the same core concepts but adjusts complexity, number ranges, and question types to meet students where they are.
What makes this resource different is the careful progression from concrete scenarios to abstract thinking, plus built-in answer keys that save you grading time. Students work through real-world data situations like favorite playground equipment, classroom pet preferences, and seasonal activities that first graders actually care about.
The worksheets are completely no-prep — just print and go. Perfect for math centers, homework, or substitute teacher plans.

Grab a Free Data Collection Sample to Try
Want to see how these strategies work in practice? I’ll send you a free sample worksheet plus my favorite data collection activity that gets first graders excited about graphs. Drop your email below and I’ll send it right over.
Frequently Asked Questions About Teaching Data Skills
When should I introduce pictographs versus bar graphs in first grade?
Start with pictographs in the first semester since students can count individual symbols more easily. Introduce simple bar graphs in spring semester after students master pictograph reading and have stronger number sense up to 20.
How many categories should first graders handle in data activities?
Begin with 2 categories for struggling students, progress to 3 categories for most first graders per CCSS.Math.Content.1.MD.C.4, and challenge advanced students with 4 categories. More than 4 becomes overwhelming for this age group.
What’s the best way to teach comparison questions with data?
Use sentence frames like “There are ___ more ___ than ___” and physical manipulatives to show the difference. Students should line up objects side-by-side to visually see “how many more” before working with abstract graphs.
How do I help students who confuse counting symbols versus counting spaces?
Have students point to each symbol while counting aloud, use different colored symbols to make them distinct, and practice with physical objects before moving to paper graphs. Consistent pointing and verbal counting eliminates this confusion quickly.
Should first graders create their own data collection questions?
Yes, but start with teacher modeling and sentence stems. Students can generate simple questions about familiar topics like “What’s your favorite color?” after they understand how to ask “How many?” and “Which has more?” questions with existing data.
Teaching data skills to first graders becomes much more manageable when you start with concrete experiences and build toward abstract thinking. The key is making data collection feel like a natural part of your classroom routine rather than an isolated math skill.
What’s your favorite way to collect data with your first graders? I’d love to hear what works in your classroom! And don’t forget to grab that free sample resource above — it’s a great way to test these strategies with your students.