If your third graders freeze when they see a ruler marked with fractions or look confused when you mention line plots, you’re not alone. Teaching measurement and data visualization is one of those skills that seems straightforward to adults but requires careful scaffolding for 8-year-olds who are still developing their understanding of fractions and measurement precision.
This post breaks down exactly how to teach CCSS.Math.Content.3.MD.B.4 with concrete strategies that work in real classrooms. You’ll walk away with step-by-step activities, differentiation tips, and solutions to the most common student misconceptions.
Key Takeaway
Students master measurement and line plots when they move from concrete measuring experiences to abstract data representation through structured, hands-on practice.
Why Measurement & Data Matters in Third Grade
Third grade marks a crucial transition in mathematical thinking. Students move from simple whole-number measurements to working with fractional parts of units. CCSS.Math.Content.3.MD.B.4 specifically requires students to measure lengths using rulers marked with halves and fourths, then organize that data into line plots.
This standard builds directly on second grade’s whole-number measurement work while preparing students for fourth grade’s more complex fraction operations. Research from the National Council of Teachers of Mathematics shows that students who develop strong measurement sense in elementary grades perform significantly better on algebraic reasoning tasks in middle school.
The timing matters too. Most teachers introduce this standard in late fall or winter, after students have had sufficient practice with basic fraction concepts in CCSS.Math.Content.3.NF.A.1. Students need to understand that 1/2 and 2/4 represent the same amount before they can accurately read fractional measurements on a ruler.
Looking for a ready-to-go resource? I put together a differentiated measurement and data pack that covers everything below — but first, the teaching strategies that make it work.
Common Measurement & Data Misconceptions in 3rd Grade
Understanding where students typically struggle helps you anticipate and address confusion before it becomes entrenched. Here are the four most common misconceptions I’ve observed:
Common Misconception: Students start measuring from the “1” mark instead of the zero point on the ruler.
Why it happens: The number “1” is visually prominent, and students think counting should start with 1.
Quick fix: Use rulers with a clear zero marking and practice “zero alignment” daily.
Common Misconception: Students think 1/4 is bigger than 1/2 because “4 is bigger than 2.”
Why it happens: They apply whole number reasoning to fraction denominators.
Quick fix: Use physical fraction strips before introducing ruler measurements.
Common Misconception: Students create line plots with uneven spacing or mixed units.
Why it happens: They focus on plotting individual points rather than understanding the scale.
Quick fix: Pre-draw the scale together before students add any data points.
Common Misconception: Students round measurements to the nearest whole number instead of reading fractional parts.
Why it happens: Fractional measurements feel “wrong” or uncertain to them.
Quick fix: Celebrate precise measurements and model reading “between the lines” explicitly.
5 Research-Backed Strategies for Teaching Measurement & Data
Strategy 1: Hands-On Measuring with Real Objects
Start with concrete experiences before introducing abstract data representation. Students need to physically manipulate rulers and measure actual objects to build measurement sense.
What you need:
- 12-inch rulers marked with halves and fourths
- Collection of small classroom objects (pencils, erasers, paper clips)
- Recording sheet with measurement blanks
Steps:
- Model proper ruler alignment with the zero point at the object’s edge
- Demonstrate reading measurements that fall between whole numbers
- Have students measure 10-12 objects, recording each measurement
- Discuss which measurements are exact versus estimated
- Compare measurements with a partner to check for accuracy
Strategy 2: Collaborative Line Plot Construction
Build line plots together as a class before expecting independent work. This shared construction helps students understand the relationship between individual measurements and data visualization.
What you need:
- Large chart paper or whiteboard space
- Sticky notes for each student’s measurement
- Pre-measured objects for consistent data
Steps:
- Create the horizontal axis together, marking intervals in fourths
- Have each student measure the same object (like their pencil length)
- Students write their measurement on a sticky note
- One by one, place sticky notes above the corresponding measurement on the line plot
- Analyze the completed plot: What do you notice? Which measurement appears most often?
Strategy 3: Measurement Scavenger Hunt with Data Collection
Combine measurement practice with data organization through structured exploration. This strategy builds stamina for measuring multiple objects while maintaining accuracy.
What you need:
- Measurement recording sheets
- Rulers for each student or pair
- List of specific objects to find and measure
- Timer for pacing
Steps:
- Provide a list of 8-10 objects students must find and measure
- Students work in pairs to locate objects and record measurements
- Set a 15-minute time limit to maintain focus
- Return to compile class data on a master line plot
- Discuss patterns and outliers in the collected data
Strategy 4: Digital Line Plot Practice with Immediate Feedback
Use technology to provide immediate feedback on line plot construction. Digital tools help students see the connection between precise measurement and accurate data representation.
What you need:
- Tablets or computers with graphing software
- Pre-collected measurement data sets
- Digital rulers for on-screen measuring
Steps:
- Provide students with a data set of measurements (like book thickness)
- Students use digital tools to create the line plot scale
- Plot each data point, with software providing alignment feedback
- Compare their digital plot to a teacher model
- Analyze the data to answer specific questions about the distribution
Strategy 5: Real-World Data Investigation Projects
Connect measurement and data skills to authentic contexts that matter to students. This strategy builds understanding of why precise measurement and data organization are important beyond school.
What you need:
- Investigation question (like “How long are students’ shoes?”)
- Data collection sheets
- Rulers and measuring tools
- Presentation materials for sharing findings
Steps:
- Pose an authentic question requiring measurement data
- Students collect data from classmates or family members
- Create individual line plots showing their findings
- Compare results across different groups or classes
- Present conclusions about patterns in the data
How to Differentiate Measurement & Data for All Learners
For Students Who Need Extra Support
Start with whole-number measurements before introducing fractional parts. Use rulers with bold half-inch markings and fewer subdivisions. Provide measurement templates with pre-drawn number lines. Practice zero-point alignment daily with guided support. Focus on one measurement skill at a time rather than combining measuring and plotting in the same lesson.
For On-Level Students
Work with standard rulers marked in fourths and halves. Measure a variety of classroom objects to the nearest quarter-inch. Create line plots independently after whole-group modeling. Practice interpreting completed line plots by answering questions about the data. Connect measurement activities to other subject areas like science experiments.
For Students Ready for a Challenge
Introduce rulers marked in eighths for more precise measurements. Compare data sets from different sources or time periods. Create multiple line plots on the same axes to show comparisons. Investigate measurement in different units (centimeters vs. inches) and convert between them. Design their own measurement investigations and present findings to younger students.
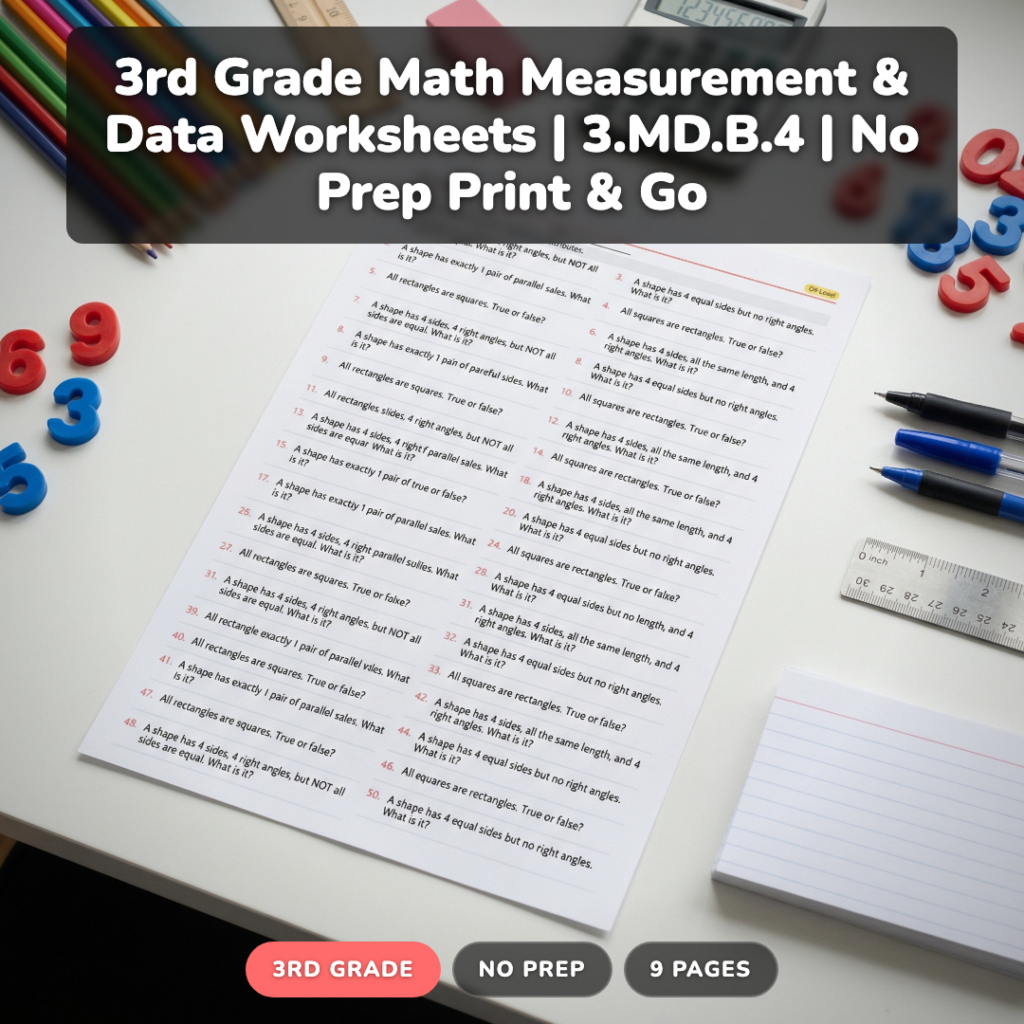
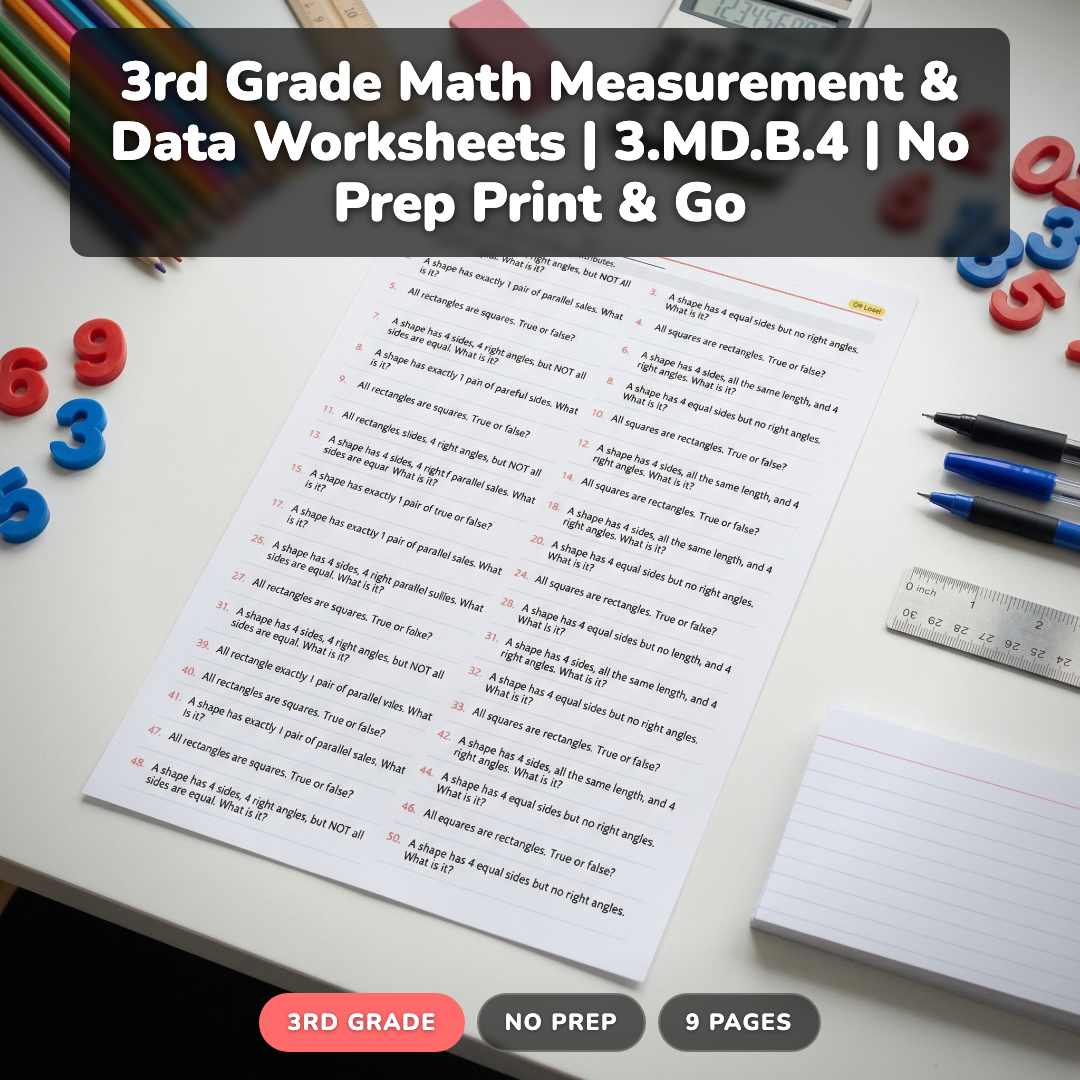
A Ready-to-Use Measurement & Data Resource for Your Classroom
After years of creating measurement activities from scratch, I developed a comprehensive resource that saves hours of prep time while providing the exact differentiation your students need. This measurement and data pack includes 132 problems across three difficulty levels, specifically designed to build mastery of CCSS.Math.Content.3.MD.B.4.
The practice level focuses on whole-number and half-inch measurements with clear visual supports. The on-level worksheets include quarter-inch measurements with varied object types. The challenge level introduces more complex data sets and requires students to create their own line plots from collected measurements.
Each level includes detailed answer keys and teaching notes that explain common student errors and how to address them. The problems progress systematically from basic ruler reading to complex data interpretation, ensuring students build confidence before tackling more challenging concepts.
You can grab this time-saving resource that covers everything from basic measurement to advanced line plot analysis.
Grab a Free Measurement Practice Sheet to Try
Want to see how these strategies work in practice? I’ll send you a free sample worksheet that includes measurement practice and line plot construction, plus teaching tips for each problem type.
Frequently Asked Questions About Teaching Measurement & Data
When should I introduce fractional measurements on rulers?
Introduce fractional ruler measurements after students understand basic fraction concepts from CCSS.Math.Content.3.NF.A.1. Most students are ready in late fall or winter, typically after mastering half and quarter fractions with manipulatives and visual models.
How do I help students who consistently misalign rulers with objects?
Practice “zero point alignment” daily for 2-3 minutes. Use rulers with highlighted zero marks, and have students place their finger on zero before measuring. Create anchor charts showing correct vs. incorrect ruler placement with visual examples.
What’s the best way to teach line plot scale creation?
Start by creating scales together as a class. Begin with the smallest and largest measurements, then mark intervals in between. Use consistent spacing and clear labels. Students should master reading existing line plots before creating their own scales independently.
How many objects should students measure for a meaningful line plot?
Collect data from at least 10-12 measurements for meaningful patterns to emerge. This provides enough data points to see distribution while remaining manageable for third graders. Fewer than 8 measurements rarely show interesting patterns.
Should students estimate before measuring?
Yes, estimation builds number sense and measurement intuition. Have students estimate first, then measure to check accuracy. This develops their ability to judge reasonable measurements and catches major errors in ruler reading or calculation.
Teaching measurement and data successfully comes down to providing enough concrete experiences before moving to abstract representations. When students understand how to read rulers accurately and see the purpose behind organizing data, line plots become a natural extension of their measurement work.
What’s your biggest challenge when teaching measurement and data? The free sample resource above includes specific solutions for the most common classroom struggles.